You can use the Administrator Toolkit to compare data between grades or between classes.
The administrator toolkit is only available with a school-wide premium subscription.
Select which option you'd like to read more about:
What is the Administrator Toolkit?
The Administrator Toolkit allows you to generate reports which compare various metrics between classes, groups or grades. For example, these reports can provide information on:
- Activity of your classes each week over a given time period
- An activity summary for different time periods
- Hard skills
- Student level
- Student proficiency
- Skills by grade
- Fact families
The data in the administrator toolkit report are a class/grade average. If you would like to view a report for an individual class/group/particular pupils, see our guide to class reports.
How to view a report from the Administrator Toolkit
- Go into Reports from your Teacher Dashboard
- Click 'More reports'

- Click 'start' in the Administrator/School Leader Toolkit box

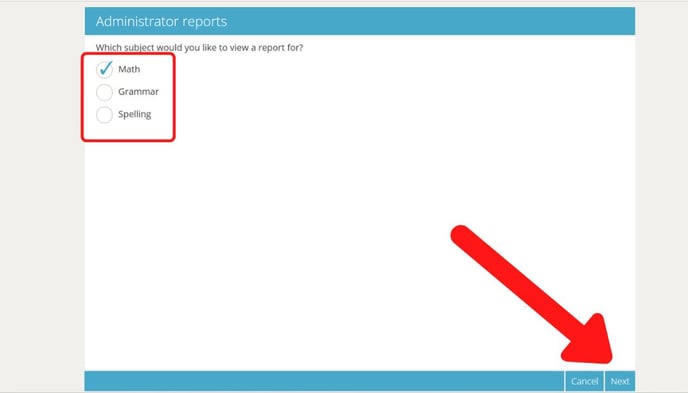
- Select the subject you want to view a report for and click 'next'
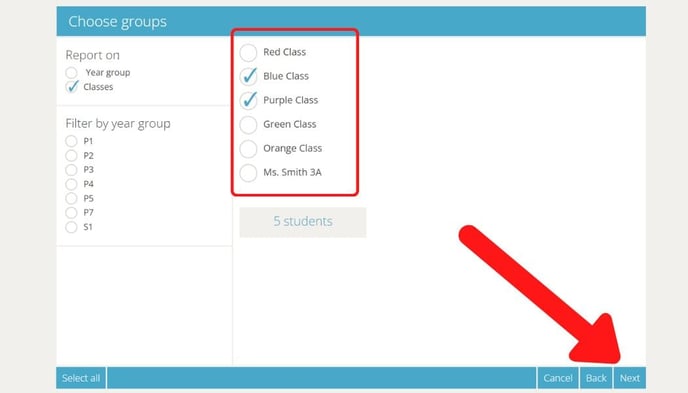
- Choose the grades or classes you want to compare data for. You can select 'grade' or 'classes' on the left to choose which options you want to see. Once you've selected your grades or classes, click 'next'
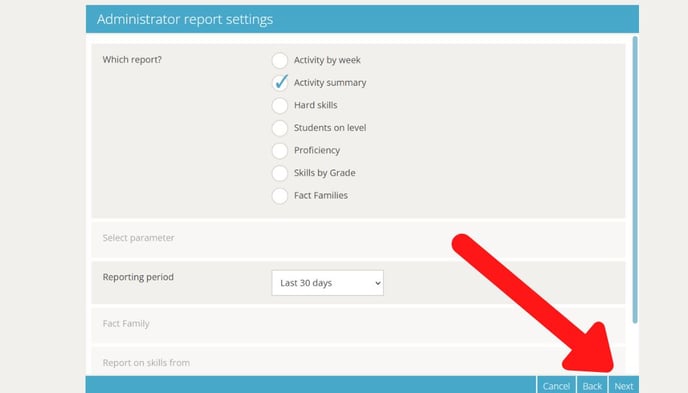
- Choose the specifications of your report and click 'next'
How to understand Administrator Report metrics
There are seven types of reports you can view with the Administrator Toolkit:
-
Activity summary
You can run an activity summary to see class averages over a selected period of time. The summary will show you the following for each class:
- Average skills completed
- Average time on Sumdog
- Average questions answered
- Average accuracy
- Average Proficiency difference between your chosen period of time
- Average proficiency score
- Students who have played
- Average correct answers
-
Hard skills
See how many students in each class are struggling with particular skills.
A skill is marked as Hard when a student has less than 50% rolling accuracy in the skill or step within the skill. Some fluency based skills will also require a pupil to have an average answer speed of 6 seconds or faster.
When a student has a Hard Skill, Sumdog will skip it and come back to it later. -
Students on level
This report shows you if your classes are behind, on track, or ahead of where they should be in the curriculum based on how far you are through the school year.
It will compare where you are in the school year, where they should be at that point, and where the class is working now. If your classes are behind or ahead, it will show you by how many months.
This report is based on the students’ diagnostic scores and how far they are in their skill plan while working on the skills set by Sumdog. If a teacher has set specific skills for their pupils as part of a challenge or another activity, those skills will not appear in this report.
-
Proficiency
Proficiency is how far through the curriculum your students are. Data is displayed in two ways:
- Growth: View the average proficiency growth over a period of time
- Score: View the average proficiency score over a period of time
-
Skills by grade
View how many students in each class have completed particular skills. You can choose to see this as a percentage or as a number of students. The data can be displayed as a table or as our traffic lights.
The traffic lights option presents a pie chart of the number/percentage of students who have completed the skill. Hover over the chart to see both the number and the percentage.
-
Fact families
View data on students' addition, subtraction, multiplication, or division abilities. You can view the data for accuracy, questions answered, speed, the number of students who attempted the skill, or the number of students who have completed the skill.
The data can be displayed as a table or a pyramid. Hovering over one of the blocks of the pyramid will give you the results for all the available parameters (accuracy, questions answered, speed, students attempted, and students completed).