Your diagnostic report shows you a range of data, from recent results to progress over time. Use the option below to read more about accessing each:
- How to view the diagnostic report
- Current Level: the most recent score compared against their expected level
- Progress: diagnostic scores over time
- Detailed Results: correct answers overall and broken down by strand
- View results of previous tests
View the diagnostic report
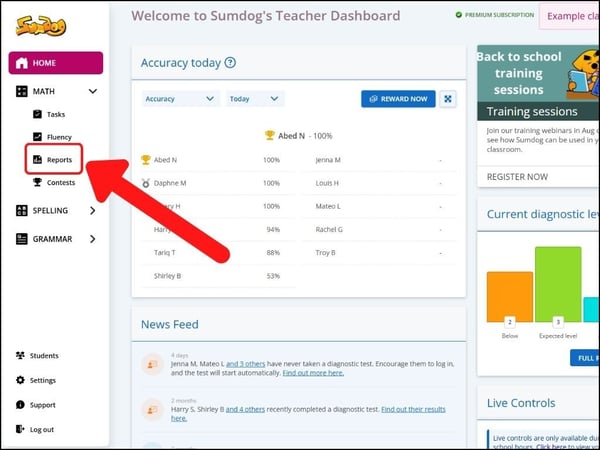
From the navigation bar on your left, click Reports under Maths.
If you teach more than 1 class, switch between them with the toggle at the top right.
You'll see a page with previews for several reports. Click detailed reports in the preview box that says Diagnostic Results..jpg?width=600&height=450&name=Support_DiagnosticResults%20(2).jpg)
You can export diagnostic the below data by clicking export on the bottom left corner of the page.
Current Level
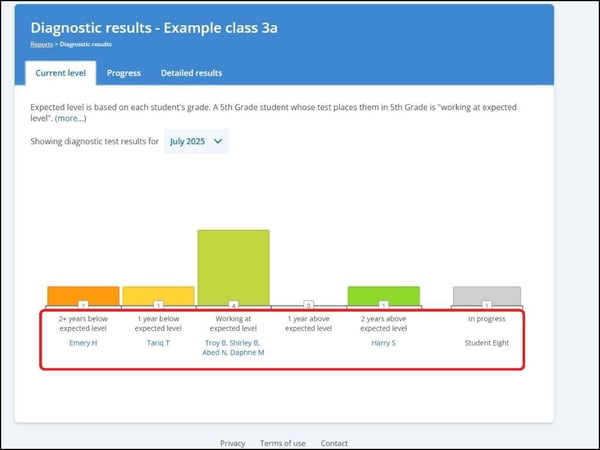
Your diagnostic results give a class overview by level - below, expected, above, and in progress.
These levels are based on a comparison between each student’s diagnostic result and their assigned year group. For example, if a student is in grade 5 but scores at a grade 4 level, they’ll be shown as “1 year below expected level.”
View Progress
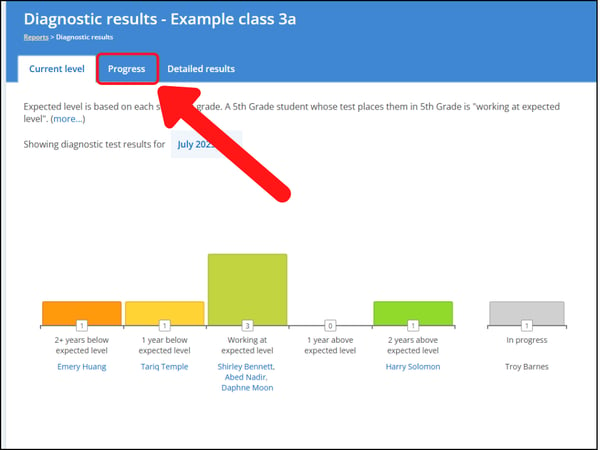
Switch to the "Progress" tab as shown in the image below.
You can view a line chart to see the change in diagnostic test scores over time. We recommend setting it once a term if you're using this report to show progress. To see this chart, choose the "Progress" tab on the report as shown below.
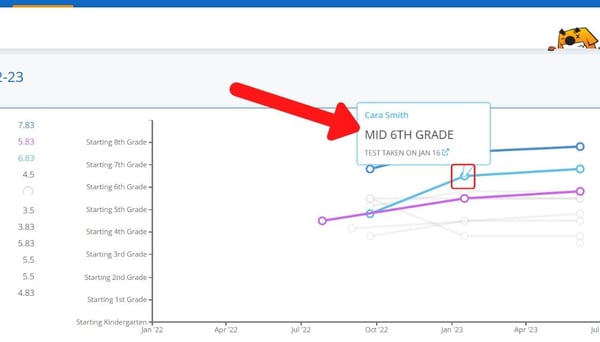
Each point on the line represents the result of a diagnostic the student has taken. Hover over the point to see the exact date and result of that diagnostic. You can click on the text in the box that appears to be taken to the full report for that diagnostic.
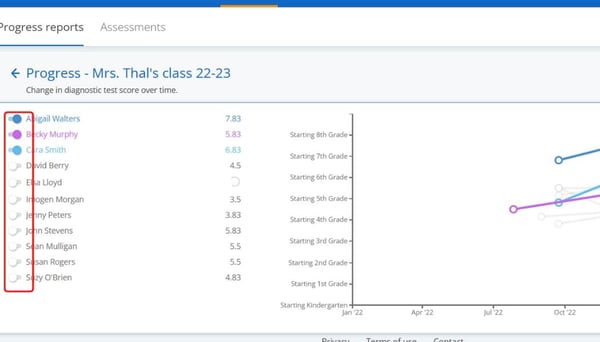
Toggle the switch next to a student's name to highlight or hide them on the graph. Each student's results will be represented by different line
Detailed Results
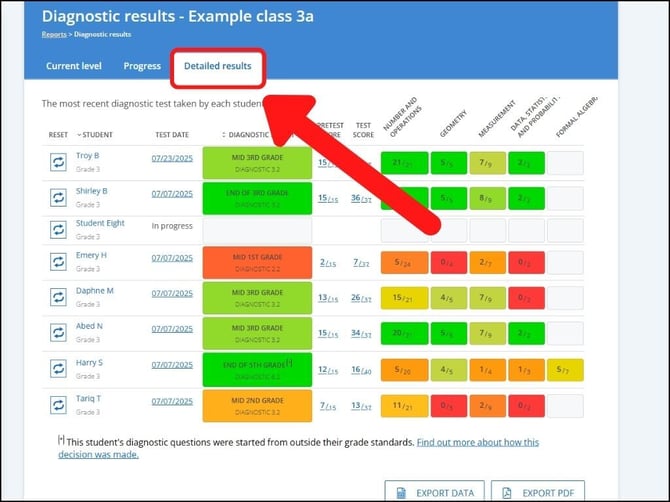
Switch to the "Detailed Results" tab as shown in the image below.
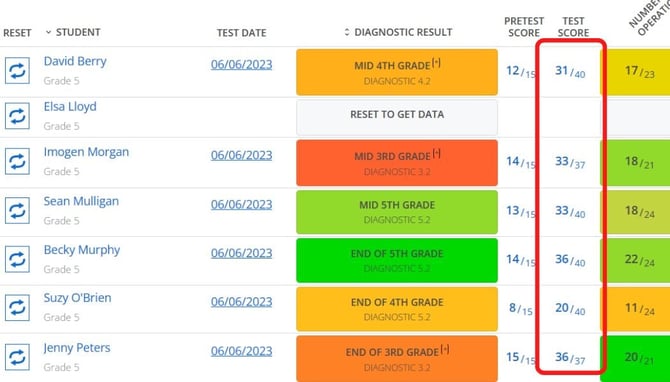
The test is taken in 2 parts: a pre-test (which determines which diagnostic they take) and the main diagnostic test. The detailed results show you the diagnostic test they took (e.g. grade 3, 4, 5 etc.) and their score in both parts of the test.
Sort students by name or diagnostic score. ‘In progress’ means the diagnostic isn’t finished yet.
The diagnostic result will give you a snapshot of your students’ progress in the curriculum on Sumdog. For example, a result of Mid Grade 4 means that your student has understood some of the Grade 4 skills on Sumdog.
Scores are shown from red (incorrect) to green (correct) and are also broken down by strand
Individual Diagnostic Reports
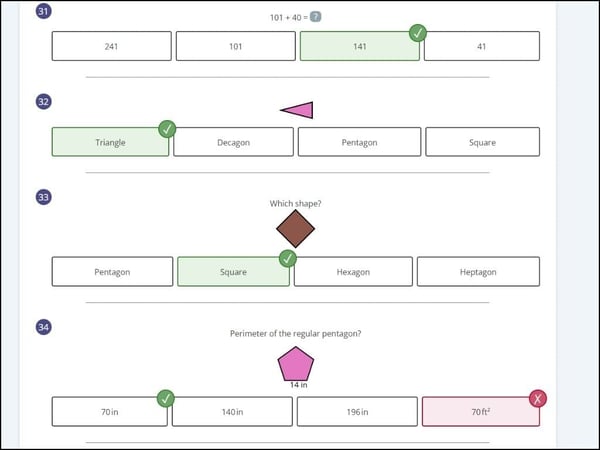
Click on a student's score to see how they answered each question
When you click on an individual student's diagnostic score, you'll be taken to their individual report (example pictured below). The individual report highlights areas of strength and weakness within the curriculum for an individual student.
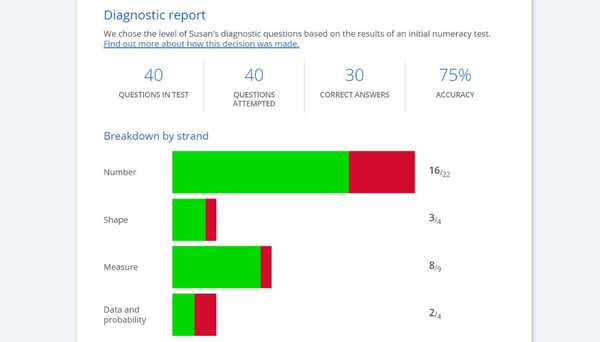
Below the strand breakdown, you'll be able to see each question the student was asked in the diagnostic as well as their answers.
Viewing results of previous diagnostic tests
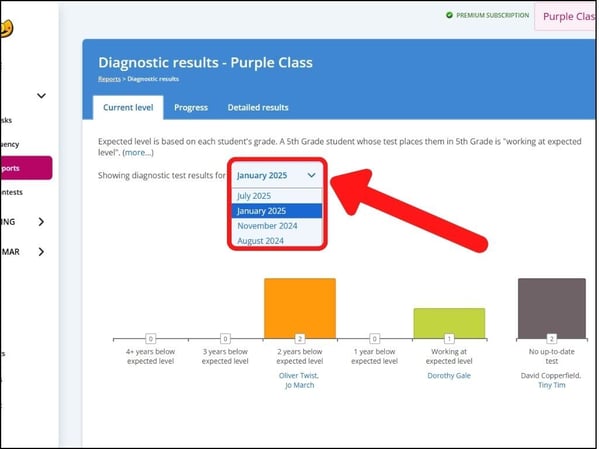
To view previous diagnostic results, use the dropdown menu on the current level. This can help you get to know new students who have joined your class from a lower year group. You can also export data and save it.