Current Diagnostic Level Chart
This can be found on your teacher dashboard. The chart shows where pupils are working relative to the curriculum for their age.
A student may be placed into one of the following categories:
- Below expected level
- Working at expected level
- Above expected level
A student's expected level corresponds to their current grade or year level. For example, if a Grade 5 student is assessed at Grade 5 by the diagnostic, they will be shown as working at the expected level on the chart.
Students may also be placed under:
- No up-to-date test: the student has not completed a diagnostic in the last four months and needs to be reset.
- In Progress: the student has started but not yet finished the diagnostic.
By clicking full report (shown below) you can also:
- Click any student's name to see their individual report
- View previous results
- See progress between diagnostic tests
- See a detailed breakdown for your whole class

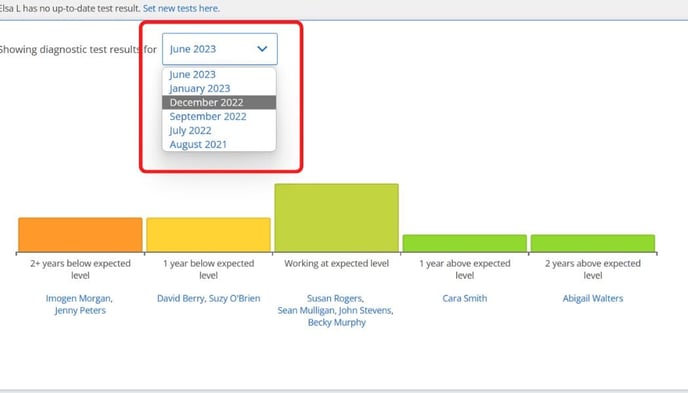
How can I see previous results?
You can view previous diagnostic results by clicking and changing the month displayed from the drop-down menu. This will change the report to show the students' current level during that month.