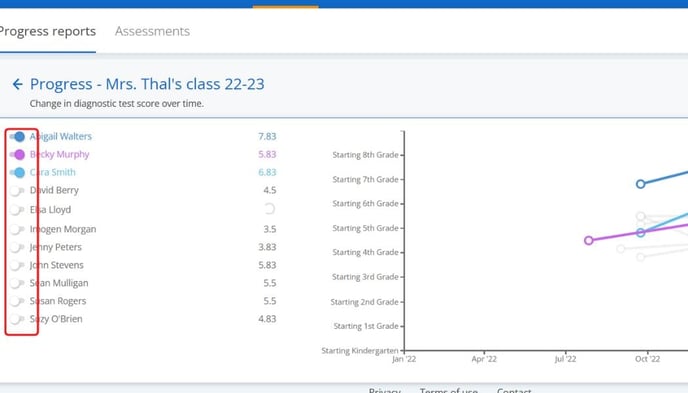
The data on the progress chart is displayed in a line graph, with each student's results represented by a line in a different colour.
How to view and interpret the Progress Chart
- Go into Fluency & Reports from your Teacher Dashboard
.png?width=655&height=374&name=Set%20work%20(5).png)
- Click 'More reports'.
.png?width=655&height=374&name=Set%20work%20(6).png)
- You'll see the most recent diagnostic results on this page. Click "detailed results" to see more.

- Click the tab that says 'Progress'. This will take you to the progress chart where you can see a line graph of your students' past diagnostic results.

- Toggle the switch next to a student's name to highlight or hide them on the graph. Each student's results will be represented by a line in a different color.
- Each point on the line represents the result of a diagnostic the student has taken. Hover over the point to see the exact date and result of that diagnostic. You can click on the text in the box that appears to be taken to the full report for that diagnostic.
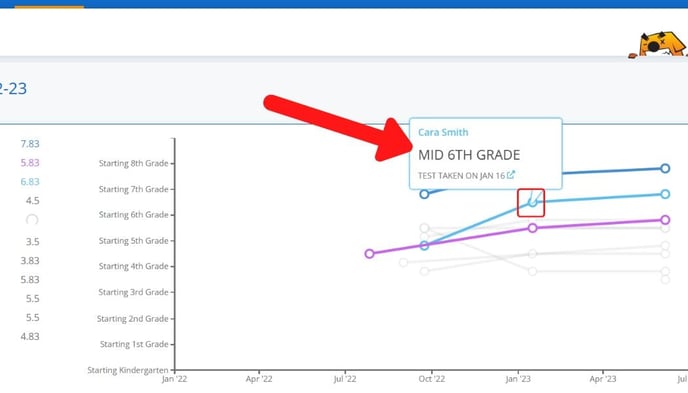
Tip: A spinning circle next to a student's name means they currently have a diagnostic in progress